ezplot
ezplot is an easy to use function plotter. The
limits of the plot will be automatically set by the MATLAB when you run the command.
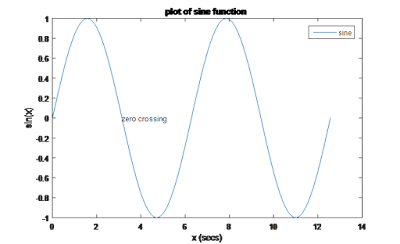
>> ezplot('sin(t)')

ezplot(‘function’,[lower_limit
upper_limit]).
The command plots the function
between the limits specified.
>> ezplot('sin(t)',[0
4*pi])

Ezplot can be used to plot curve
between two functions.
ezplot(‘function1’,’function2’,
[lower_limit upper_limit])
The command plots function1(t)
versus function2(t) over lower_limit
< t < upper_limit.
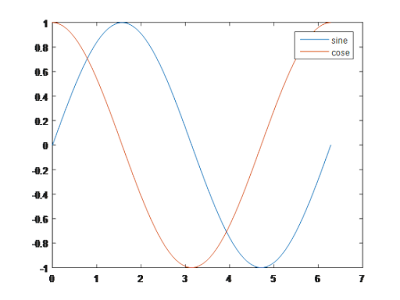
>> ezplot(’cos(t)’, ’sin(t)’, [0 2*pi]); axis square

You may also use a function
handle to an existing function. Function handles are more powerful and
efficient than string expressions.
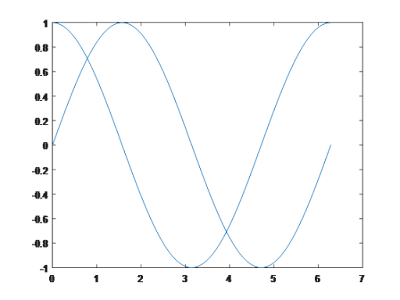
>> ezplot(@cos,@sin)
The command will give same plot
as ezplot(’cos(t)’, ’sin(t)’, [0 2*pi]).
(About function handles we will
discuss later)
Contour Plots
contour(Z) draws a contour plot of matrix Z in
the x-y plane, with the x-coordinates of the vertices corresponding to column
indices of Z and the y-coordinates corresponding to row indices of Z. The
contour levels are chosen automatically.
A contour plot of a function of two variables is a
plot of the level curves of the function, that is, sets of points in the x-y
plane where the function assumes a constant value. For example, the level
curves of x2 + y2 are circles centered at the origin, and the levels are the
squares of the radii of the circles.
We can make a contour plot of x2 + y2 as follows:
>> [x y] = meshgrid(-1:0.1:1, -1:0.1:1); %
meshgrid is used to make grid of defined points.
>> contour(x, y, x.ˆ2 + y.ˆ2)

Field Plots
The MATLAB routine quiver is used to plot vector
fields or arrays of arrows. The arrows can be located at equally spaced points
in the plane (if x and y coordinates are not given explicitly), or they can be
placed at specified locations.
quiver(U,V) plots velocity vectors at equally
spaced points in the x-y plane.
The following code, for example, plots a vector field
similar to the magnetic field near a magnetic dipole.
>> [x,y] = meshgrid(-1:.1:1,-1:.1:1);
>> z=x.*exp(-x.^2 - y.^2);
>> [a b] = gradient(z);
>> quiver(a,b)

Scatter Plot
scatter(x, y, size, color) displays colored circles
at the locations specified by the vectors x and y (which must be the same
size). ‘Size’ determines the size of
each circle marker and ‘color’ defines the color of the marker.
scatter(x, y) will plot the markers with default size and
color.
Size can be a scalar or a vector the same length as x and
y. If size is a scalar, MATLAB draws all the markers the same size. If it is
empty, the default size is used. If size is a vector, each marker will take a
size corresponding to value specified in the vector. Color also may be a
vector, then the values in color vector are linearly mapped to the colors in
the default colormap (colormap is RGB color lookup table of MATLAB).
>> x = -1:0.1:1;
>> y = x.^2;
>> s = 1:21;
>> c = s;
>> scatter(x,y,s,c)

Compass Plot
compass(U,V) draws a graph that displays the
vectors with components (U,V) as arrows starting from the origin.
compass(Z) is equivalent to compass(REAL(Z),IMAG(Z)).
This plot is very useful to represent the phasors.
>> v=3+4i
>> i=2-1i
>> compass(v)
>> hold on
>> compass(i)

Area Plot
Area plot is used to plot a filled 2D plot. The graph
displays elements in Y as one or more curves and fills the area under each
curve. The plot will be same as the ‘plot’ command, but the area between the x
axis and the curve will be filled in with color.
>> x=0:10;
>> y=2.*x-1;
>> area(x,y)
>> xlabel('x value')
>> ylabel('y values')
>> title('area plot example')

Filled Shapes
fill(x, y, 'c') command can be used to draw filled polygons.
The function plots a 2D polygon defined by the column vectors x and y and fills
with the color specified by c. The vertices of the polygon are specified by the
pairs (xi, yi). If necessary, the polygon is closed by connecting the last
vertex to the first. Like the plot function, fill can have any number of pairs
of vertices and associated colors.
>> x=[-1 0 1];
>> y=[0 1 0];
>> fill(x,y,'r')

Bar Graph
bar(x, y) or bar(y) command is used to plot the bar
graph. It plots bars for each value of x, the height as y. If only one vector
as argument, the graph will be plotted against the length of the vector.
bar(x,y, width) or bar(y, width) specifies
the width of the bars. Values of width > 1 produce overlapped bars. The default value is 0.8
>> x=0:10;
>> y=2.*x-1;
>> bar(x,y)
>> title('bar plot example')

Histogram Plot
Histogram plots are used to represent the distribution of
a variable with in a range.
hist(z) command produces a histogram bar plot of
values of z for a default 10 division of toral range.
hist(z, n) produces a histogram bar plot of values
of z for n equal divisions
>> z=rand(1,100)
>> hist(z)
>> xlabel('z value')
>> ylabel('frequency of z')
>> title('histogram example')

histogram(z) creates a histogram plot of z. The
histogram function uses an automatic binning algorithm that returns bins with a
uniform width, chosen to cover the range of elements in z.
Pie Charts
Standard pie charts can be created by using the pie(x) function, where x is a vector of
values.
pie(x, b) used
to plot pie chart and pull out a specific section of the pie chart, where b is
the logical vector describing a slice or slices to be pulled out of the pie
chart. The pie3 function is used to
draw the pie chart with a 3-D appearance.
>> x=rand(1,6);
>> pie(x)
>> title('Example Pie Chart')

>> pie(x,x==max(x)) % pulls out the slice of maximum share
>> title('Example Pie Chart')